Inside the 2025 South Carolina BBQ Survey: What You Will Learn
Over 1,350 South Carolinians weighed in on everything from pit-smoked meats to mustard-vs-vinegar sauces, giving us an in-depth look at how barbecue lives in the Palmetto State. We didn’t stop there: we also analyzed digital engagement on Destination-BBQ.com and in the I Love SC BBQ Facebook group—to see how online behavior mirrors and amplifies real-world barbecue habits.
In this report on our 2025 South Carolina BBQ Survey, you’ll find concise insights on:
- Meats & Preparations: favorite cuts, serving styles, and emerging brisket trends
- Sauces: top rankings, regional loyalties, and even where people source theirs
- Hash & Sides: which type of hash you prefer and how you it, your go-to accompaniments, and state, region, and county standouts
- Restaurant Habits: dining frequency, spending patterns, health considerations, and your favorite BBQ restaurants in South Carolina
- Home-Cooking: the equipment, fuels, and meats powering backyard barbecues
- Digital Footprint: website search behavior on Destination-BBQ.com and engagement spikes in our Facebook Group
What emerges is a story of unity and diversity: pork remains king, “hash over rice” is almost universal, and mustard-style sauces still dominate in the Midlands while vinegar rules the Pee Dee. At the same time, every region—and nearly every county—brings its own twist.
Keep reading to explore statewide takeaways, regional contrasts, and county-level highlights that together map out the living tradition of South Carolina barbecue.
Stay in the loop with SC BBQ insights. Sign up for the Destination BBQ newsletter to get first notification for next year’s survey, behind‑the‑scenes stories, and access to new recipes:
Subscribe Now
Who Loves South Carolina BBQ? Survey Demographics
Before we get into the finer points of hash, whole hog, and sauce styles, let’s take a moment to look at who answered the survey. The data below gives us a snapshot of the people who make up South Carolina’s barbecue community—from age and gender to where they call home.
Age Distribution
Asked as “Your Age:”
| Table 1 | ||
| Age Range | Responses | Percentage |
| 65+ | 346 | 28% |
| 55–64 | 289 | 23% |
| 45–54 | 271 | 22% |
| 35–44 | 223 | 18% |
| 25–34 | 95 | 8% |
| 18–24 | 18 | 1% |
| Under 18 | 1 | 0% |
What this shows:
South Carolina’s barbecue scene is especially strong among those 45 and older, who make up nearly three-quarters of our respondents. While younger adults are underrepresented, their presence in the data hints at a generation beginning to shape its own barbecue traditions.
Gender Breakdown
Asked as “Your Gender:”
| Table 2 | ||
| Gender | Responses | Percentage |
| Male | 1,090 | 87% |
| Female | 154 | 12% |
| Prefer not to say | 4 | 0% |
What this shows:
The vast majority of respondents identify as male, but a meaningful number of women are also taking part in the conversation around SC BBQ—something worth celebrating as the culture continues to evolve.
Region Selected
Asked as “Your Region in SC:”
| Table 3 | ||
| Region | Responses | Percentage |
| Midlands | 455 | 33.7% |
| Upstate | 379 | 28% |
| Lowcountry | 305 | 22.6% |
| Pee Dee | 211 | 15.6% |
What this shows:
Representation came from every corner of the state, with the Midlands contributing the largest share of responses. The Upstate, Lowcountry, and Pee Dee regions also provided strong participation, setting the stage for meaningful regional comparisons throughout the report.
BBQ Meats: What Do South Carolinians Prefer?
Barbecue in South Carolina always starts with the meat. In this section, we asked respondents how often they eat BBQ, whether health concerns factor into those decisions, and what meats—and preparations—they prefer most.
From pork and brisket to ribs and chicken, the answers offer a revealing look at not only what’s on the plate, but how regional traditions and personal tastes continue to shape the state’s barbecue culture.
How Often Do You Eat BBQ?
We began the meats section by asking South Carolinians a simple but telling question: how often do you find yourself enjoying barbecue—whether at home, at a restaurant, or anywhere in between?
Question Asked: On average, about how often do you eat BBQ? (from anywhere: home-cooked, restaurants, etc.)
Statewide Results
Out of 1,335 people who responded:
- Couple of Times a Month: 53%
- Once a Week: 20%
- Once a Month: 20%
- Rarely (less than 12 times a year): 7%
- Never (or almost never):
Regional Breakdown
| Table 4 | |||||
| Region | Couple of Times a Month | Once a Week | Once a Month | Rarely | Never |
| Lowcountry | 52.0% | 19.1% | 20.5% | 8.1% | 0.3% |
| Midlands | 54.1% | 16.4% | 21.7% | 7.8% | 0% |
| Pee Dee | 56.9% | 21.5% | 17.2% | 4.3% | 0% |
| Upstate | 49.6% | 25.7% | 19.8% | 4.8% | 0% |
What It Tells Us
Barbecue isn’t just an occasional indulgence in South Carolina—it’s a regular part of life. Over half of respondents across the state said they eat BBQ at least a couple of times each month, with a solid one in five eating it weekly.
But the rhythm of barbecue varies a bit depending on where you live.
In the Upstate, nearly 26% of respondents eat BBQ weekly, the highest rate of weekly consumption in any region.
County Highlights
Anderson County in particular stood out, with nearly 29% of locals reporting weekly BBQ habits—among the highest of any county.
Meanwhile, the Pee Dee region showed the most consistent mid-range engagement, with over 56% eating BBQ a couple of times a month, and a relatively low share saying they “rarely” eat it. It’s a strong signal that BBQ is a steady presence in the Pee Dee’s mealtime routine.
Some counties, like Aiken, reflected this balanced approach as well—54% said “a couple of times a month,” but a notable 16% said “rarely”, suggesting more variance in barbecue frequency even within regions.
And then there are the outliers: Allendale County had just one respondent, but that person reported eating BBQ “a couple of times a month,” keeping the streak alive—only one person statewide said they almost never eat BBQ.
Altogether, the message is clear: whether it’s every week or just now and then, barbecue has a steady and loyal following in all corners of the state.
Do Health or Dietary Concerns Affect BBQ Frequency?
While barbecue may be a beloved staple across South Carolina, not everyone indulges as often as they’d like. For some, health or dietary concerns play a role in how frequently they fire up the smoker or place an order at their favorite joint.
Question Asked: Do health/dietary concerns or choices impact HOW OFTEN you choose to eat barbecue?
Statewide Results
Out of 1,335 respondents:
- No, dietary concerns do not impact frequency: 79% (1,054 responses)
- Yes, dietary concerns do impact frequency: 21% (281 responses)
Regional Breakdown
| Table 5 | ||
| Region | No | Yes |
| Lowcountry | 72.8% | 27.2% |
| Midlands | 82.0% | 18.0% |
| Pee Dee | 84.2% | 15.8% |
| Upstate | 77.5% | 22.5% |
What It Tells Us
For most South Carolinians, health concerns take a back seat to barbecue. Nearly 4 in 5 respondents say their eating habits aren’t shaped by diet or health restrictions when it comes to BBQ. But for a noteworthy minority—21%—those concerns do matter.
Looking closer, the Lowcountry stands out with the highest percentage of respondents reporting that diet or health impacts their BBQ intake, at 27.2%. On the other end of the spectrum, the Pee Dee shows the lowest percentage (15.8%), suggesting that folks there are less likely to let health concerns get between them and their pulled pork.
County Highlights
At the county level, a few places stood out for how health and dietary concerns factor into BBQ habits:
- Charleston County, one of the state’s largest by population, leaned slightly above the statewide average, with about 27% saying dietary concerns affect how often they eat BBQ.
- In Dorchester County, the majority are less concerned: about 23% said "yes," while more than three-quarters reported that health choices do not limit their BBQ intake.
- Greenville County, in the Upstate, landed in a similar range with 27% saying "yes", close to Charleston’s figure.
- Georgetown County showed even less concern, with only 16% reporting that dietary considerations impact their BBQ frequency, which is well below the statewide average.
While most counties hovered near or slightly above the state average, it’s clear that preferences shift subtly by community. Coastal areas like Charleston and Georgetown varied, while larger Upstate counties such as Greenville reflected steady but moderate concern. Dorchester, meanwhile, leaned more heavily toward carefree enjoyment of barbecue.
These numbers reveal more than preferences—they offer insight into how BBQ fits into different communities’ lifestyles. In some places, barbecue remains a guilt-free pleasure. In others, it’s more of a calculated choice. Either way, there’s no question: health matters to a meaningful slice of South Carolinians who still love their ’cue.
Most Popular BBQ Meats in South Carolina: Pork, Brisket & More
Barbecue means different things to different people, but at its heart, it often comes down to one question: what meat is going on your plate?
We asked South Carolinians to tell us which meats they prefer when it comes to BBQ. Respondents could select as many options as they liked, offering a broad view of the state’s barbecue leanings. As such, the percentages below (which are rounded) reflect what percent of the total number of people selected a given meat. That is, 55% of 1,344 respondents picked pork cuts, 49% of those same people also picked whole hog, etc.
Question Asked: Your Preferred BBQ, Choice of Meat: (select any that apply)
Statewide Results
(1,344 respondents; multiple selections allowed)
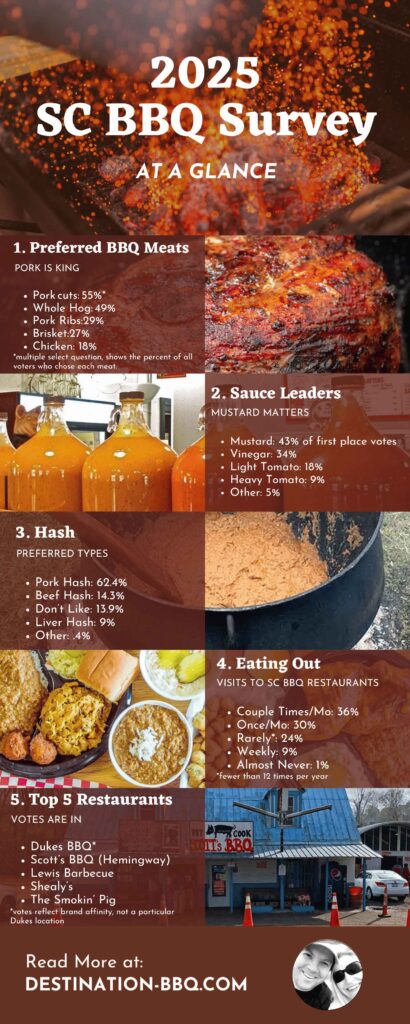
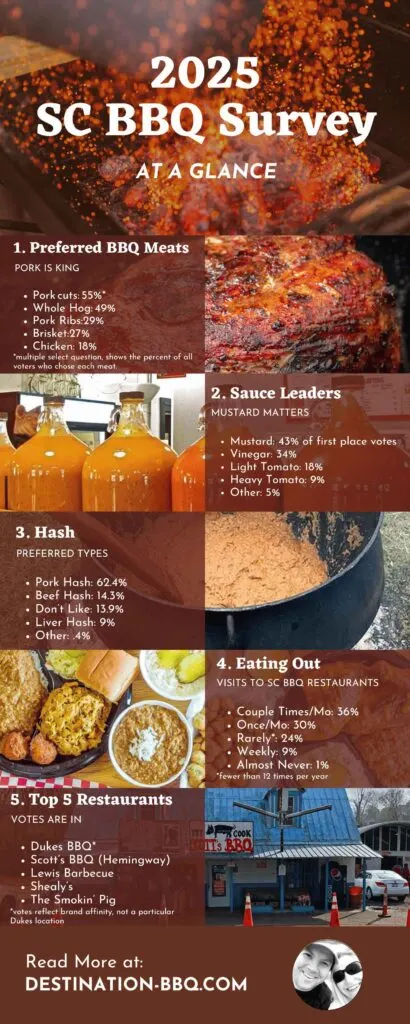
- Pork, from cuts (butts, etc.): 55%
- Pork, from whole hog: 49%
- Pork Ribs: 29%
- Brisket: 27%
- Chicken: 18%
- Sausage: 11%
- Beef Ribs: 11%
- Turkey: 4%
Regional Breakdown (Top 4 Meats)
| Table 6 | ||||
| Region | Whole Hog | Pork Cuts | Brisket | Pork Ribs |
| Lowcountry | 54.6% | 51.7% | 29.5% | 28.8% |
| Midlands | 48.0% | 58.7% | 24.7% | 27.3% |
| Pee Dee | 62.6% | 60.4% | 25.3% | 34.1% |
| Upstate | 36.2% | 51.1% | 28.5% | 25.6% |
What It Tells Us
In South Carolina, pork reigns supreme—but exactly how it’s preferred depends on where you are.
Statewide, pork from cuts like Boston butt led the pack, with 55% of respondents choosing it, followed closely by whole hog pork at 49%. These two choices stand as the backbone of South Carolina barbecue, and their near parity shows just how strong the tradition of whole hog is—even as other meats have become more common.
Regional loyalties were clear. In the Pee Dee, a historic stronghold of whole hog barbecue, about 63% of respondents chose whole hog—the highest of any region. It edged out pork cuts in popularity there, underscoring the region’s deep connection to traditional whole hog cooking.
By contrast, in the Upstate, only 36% chose whole hog, and pork cuts took a stronger lead. This matches broader trends in the Upstate’s BBQ scene, where shoulders and butts are more common than pit-cooked whole hogs.
Among the other meats, pork ribs and brisket battled it out for third and fourth place, each preferred by just over a quarter of respondents. Brisket, once a rarity in the South, has carved out a notable following across all regions—with slightly higher enthusiasm in the Upstate (29%) and Lowcountry (30%).
Chicken, sausage, and beef ribs trailed behind, but still made respectable showings. Turkey, though the least selected meat at 4% statewide, has its niche.
County Highlights
Several counties revealed distinct preferences worth noting:
- In Abbeville County, pork cuts were far and away the favorite: 77% of respondents chose them—by far the strongest preference for pork cuts of any county.
- Florence County, at the heart of the Pee Dee, leaned heavily into whole hog, with 74% choosing it, continuing the region’s reputation.
- Greenville County showed broader tastes: pork cuts led at 58%, with brisket also popular at 36%, reflecting the diversity of barbecue options in this fast-growing area.
- Berkeley County was more evenly split than others: 46% preferred whole hog, while 48% preferred pork cuts, suggesting balanced preferences across styles.
The variety in responses—from Lowcountry to Upstate, and from pork traditionalists to brisket newcomers—confirms what anyone who’s traveled this state already knows: barbecue in South Carolina may have deep roots, but it also continues to branch out.
How Do You Prefer Your Pork BBQ Served?
For those who chose pork—either from cuts or whole hog—we asked a follow-up: how do you like it served? South Carolina has a long tradition of both pulled and chopped pork, and we wanted to see which style resonated most.
Question Asked: How You Prefer Your Pork BBQ Served
Statewide Results
Among pork BBQ fans:
- Pulled: 70%
- No Preference: 17%
- Chopped: 13%
Regional Breakdown
| Table 7 | |||
| Region | Pulled | No Preference | Chopped |
| Lowcountry | 74.0% | 17.0% | 8.9% |
| Midlands | 66.9% | 18.5% | 14.7% |
| Pee Dee | 72.1% | 15.6% | 12.3% |
| Upstate | 69.1% | 14.9% | 16.0% |
What It Tells Us
Across the state, pulled pork is the clear favorite, with nearly 7 in 10 pork lovers preferring their barbecue served in long, tender strands. That said, chopped pork—finely cut for a more consistent texture—is still holding on, especially in pockets of the Midlands and Pee Dee.
The Lowcountry and Pee Dee led in pulled pork preference, each with over 70% of respondents favoring it. By contrast, the Upstate showed the strongest support among the regions in the chopped pork category at 16%, even though pulled was still the top choice.
One caveat: the apparent preference for pulled pork may be more of a language preference than a culinary one. The phrase “pulled pork” has become synonymous with pork barbecue, regardless of how the meat is actually prepared for the plate. As such, people may have been more likely to select “pulled pork” because that is the term they are most comfortable with.
County Highlights
- In Lexington County, over 75% of pork eaters prefer it pulled, one of the highest rates in the state.
- In Darlington County, however, preferences leaned more toward Pulled and No Preference. About 73% preferred pulled, while 27% had no preference, making it notable for having no support at all for chopped pork.
- In Richland County, preferences were more spread out: 67% chose pulled, 21% had no preference, and 12% favored chopped — one of the more balanced profiles.
- Charleston County came in strong for pulled pork with nearly 78%, and low interest in chopped (just under 8%).
This question didn’t just reveal preferences—it also traced the lines of tradition. Pulled pork may dominate across South Carolina, but chopped still holds its ground in places where whole hog has long been the norm.
Should Pork BBQ Be Sauced Ahead of Time?
After finding out how people like their pork BBQ served, we asked a follow-up question that often sparks strong opinions: Should it be sauced before it hits your plate, or do you prefer to add sauce yourself—or skip it altogether?
Question Asked: Prefer your Pork BBQ Sauced Ahead of Time?
Statewide Results
(1,084 responses from those who selected pork)
- No (prefer unsauced): 45%
- Yes (sauced ahead): 34%
- No Preference: 21%
Regional Breakdown
| Table 8 | |||
| Region | No | Yes | No Preference |
| Lowcountry | 41.2% | 31.3% | 27.6% |
| Midlands | 43.6% | 35.4% | 21.0% |
| Pee Dee | 26.8% | 57.9% | 15.3% |
| Upstate | 60.6% | 20.4% | 19.0% |
What It Tells Us
Statewide, more people prefer their pork unsauced than sauced, but not by a wide margin. About 45% want it to stand on its own, while 34% favor it sauced ahead of time—and 21% are fine either way.
The real story lies in the regional contrasts.
In the Pee Dee, a clear majority—nearly 58%—prefer their pork sauced ahead of time, making it the only region where that option was the most popular. This lines up with the region’s deep roots in vinegar-pepper sauces, which are often applied generously and early.
By contrast, the Upstate is by far the most sauce-averse, with 61% preferring their pork unsauced—a nod to more sauce-on-the-side tradition.
Lowcountry and Midlands were more evenly split, leaning slightly in favor of unsauced pork but with a healthy share of folks who either want sauce or don’t mind either way.
County Highlights
- Anderson County strongly favored unsauced pork, with over 71% saying no—well above even the Upstate regional average.
- Bamberg County went the other direction, with two-thirds of respondents choosing "No Preference", suggesting a more flexible crowd. However, the number of Bamberg respondents was low, which may have skewed the data.
- Berkeley County showed a near-perfect balance: 35% said yes, 35% said no, and 30% had no preference—making it one of the most evenly split counties in the state.
- Clarendon County leaned distinctly toward sauce, with 63% preferring it sauced ahead of time, matching trends seen in the Pee Dee.
While pulled pork might be the go-to style, and preferences for chopped still linger, how that pork is finished—with sauce or without—remains a dividing line that’s sharply drawn depending on where you are in South Carolina.
Brisket Preferences: Cut, Style, and Slice
Brisket may not be the first meat that comes to mind when you think of South Carolina BBQ, but it has carved out a place on many local menus—and in the hearts of a growing number of fans. For those who chose brisket, we followed up with two questions: how they prefer it served, and which part of the brisket they favor.
Chopped or Sliced?
Question Asked: How You Prefer Your Brisket Served
Statewide Results
(361 responses)
- Sliced: 81%
- Chopped: 9%
- No Preference: 9%
Flat or Point?
Question Asked: Which Part of the Brisket Do You Prefer
Statewide Results
(363 responses)
- Fatty (point): 47%
- No Preference: 31%
- Lean (flat): 22%
What It Tells Us
Brisket eaters in South Carolina have a clear favorite: they want it sliced. Whether it’s the influence of Texas-style joints or just a love for that tender texture, over 80% of brisket fans statewide prefer sliced over chopped.
On the question of fatty versus lean, the point wins out. Nearly half of respondents said they prefer the fatty “point” section, which tends to be juicier and more flavorful. Only about one in five favored the leaner “flat,” and a sizable third said they don’t have a strong preference.
Regional Breakdown
Across all regions, sliced brisket dominated:
- Pee Dee: 85% sliced, highest in the state
- Lowcountry and Upstate: both around 82% sliced
- Midlands: 81% sliced, with a slightly higher share (12%) preferring chopped
As for which part of the brisket folks favor:
- Upstate respondents were the most loyal to the fatty point, with 53% choosing it—more than double those who preferred lean.
- The Lowcountry had the most balanced response, with 41% choosing fatty, 27% choosing lean, and 32% saying no preference.
- Interestingly, the Midlands showed the highest rate of “no preference” at 39%, suggesting either an openness or a less brisket-experienced audience.
County Highlights
- Anderson County leaned toward the point, with 6 of 14 brisket eaters choosing it and only 4 choosing the flat.
- Richland County, one of the state’s more urbanized areas, showed a mixed but slightly point-leaning preference among brisket fans.
- Several smaller counties—including Allendale, Bamberg, and McCormick—had no brisket data at all, underscoring brisket’s still-limited reach in more rural or traditional pork-strong areas. Note: It’s also true that these counties had few respondents in general.
Brisket may not yet rival pork in South Carolina, but it’s firmly established a place at the table. And when folks here go for it, they’re usually hoping for a juicy, sliced cut from the fattier side of the brisket.
The Meats of SC BBQ: Conclusion
If there’s one thing the responses in this section made clear, it’s this: barbecue is more than a meal in South Carolina—it’s a regular habit, a regional expression, and a deeply personal preference.
More than half of respondents say they eat BBQ at least a couple times a month, with another 20% enjoying it weekly. That kind of frequency speaks to just how woven barbecue is into the daily lives and dinner tables across the state. And while health and dietary concerns factor into the choices for some, most folks aren’t letting it stop them from getting their fix.
When it comes to what’s on the plate, pork is still king, but how it’s cooked, served, and sauced varies in telling ways by region. Whole hog remains strong—especially in the Pee Dee, where it still competes closely—but pork from cuts like butts and shoulders holds a slight edge overall. Pulled pork is the state’s dominant style, though chopped still holds ground in traditional areas.
Even the question of whether pork should be sauced ahead of time split the state. In the Pee Dee, a clear majority preferred it sauced. In the Upstate, most said no. In the Upstate, most said no. And in places like the Midlands and Lowcountry, preferences were mixed, reflecting the diverse traditions that converge in those regions.
Brisket, while less commonly chosen, has found a solid and growing following—particularly sliced and from the fattier “point” section. Its presence underscores the evolving nature of BBQ in South Carolina, where new styles are welcomed even as older ones remain deeply rooted.
Together, the responses in this section paint a picture of a state that may not always agree on the details of barbecue—but one that is united in its love for it. (Why else would the SC Department of Tourism have created the SC BBQ Trail in the first place?) Whether you prefer your pork chopped and sauced or sliced brisket with a little fat, there’s room at the table for every taste.
Explore 300 pages of SC BBQ—family favorites, pitmaster secrets, whole-hog pit plans, and restaurant recipes—in our SC BBQ cookbook Going Whole Hog:
Order Your Copy
South Carolina BBQ Sauce Preferences: Mustard, Vinegar, Tomato and Regional Loyalties
Few topics stir up as much debate—or pride—as barbecue sauce in South Carolina. Whether tangy and golden, sharp and vinegary, or sweet and tomato-rich, sauces are more than a condiment—they’re a statement. Of course, the best BBQ sauce in South Carolina will always be subjective.
In this section of the survey, we asked respondents to weigh in on their personal preferences, the sauce styles most associated with their counties and regions, and where they typically get their sauce. For those who make their own or have a go-to brand or local BBQ joint, we dug a little deeper to find out what’s most popular across the state.
What emerged was a rich, complex map of sauce loyalty and local tradition. From the mustard-strong Midlands to the vinegar-loving Pee Dee—and every pantry, pit, and bottle in between—this section captures how South Carolinians think about the sauces that define their barbecue.
Favorite BBQ Sauces
When it comes to BBQ sauce preferences across South Carolina, the numbers tell a clear story: mustard-based sauce tops the list statewide—but it’s not without strong competition.
Survey respondents were asked to rank seven BBQ sauce options from favorite to least favorite. With over 1,300 people participating, mustard sauce emerged as the overall favorite.
Question Asked: YOUR FAVORITE: Click or drag to rank each basic BBQ sauce type from Favorite to Least Favorite (top = favorite)
- Vinegar Based BBQ Sauce (no ketchup/tomato added)
- Light Tomato Based BBQ Sauce (vinegar-based with some ketchup/tomato added)
- Mustard Based BBQ Sauce
- Heavy Tomato Based BBQ Sauce (similar to Sweet Baby Ray's or KC Masterpiece)
- Alabama White Sauce
- Other
- I Don't Like BBQ Sauce of any Type
Statewide Results
- Mustard-Based Sauce took the top spot with an average rank of 2.2, and 43% of those who ranked it placed it at #1.
- Vinegar-Based Sauce (no tomato) followed closely with an average rank of 2.5, earning the top spot from a third of participants.
- Light Tomato-Based Sauce (vinegar with a bit of ketchup or tomato) came in third at 2.7.
Lower in the rankings were:
- Heavy Tomato-Based Sauce (like Sweet Baby Ray’s) – 3.8 average
- Alabama White Sauce – 4.8 average
- Other – 5.3 average
- I Don’t Like BBQ Sauce of Any Type – 5.9 average
Sauce Preferences by Region
While mustard-based BBQ sauce was the overall favorite across South Carolina, regional results reveal a more detailed and interesting story—one shaped by local traditions and shifting tastes. Here's how survey respondents said sauces are most commonly associated with their regions:
| Table 9 | |||
| Region | 1st Place | 2nd Place | 3rd Place |
| Lowcountry | Mustard (64.63%) | Vinegar (18.37%) | Light Tomato (12.24%) |
| Midlands | Mustard (83.45%) | Light Tomato (7.83%) | Vinegar (5.59%) |
| Pee Dee | Vinegar (69.52%) | Light Tomato (20.48%) | Mustard (7.62%) |
| Upstate | Light Tomato (33.15%) | Mustard (28.26%) | Heavy Tomato (27.72%) |
Observations
- Midlands shows overwhelming loyalty to mustard-based sauce, with little competition.
- Lowcountry is also strongly mustard-leaning but still shows meaningful support for vinegar and light tomato styles.
- Pee Dee stands firmly behind vinegar-based sauces, in line with the region’s deep roots in vinegar-and-pepper whole hog barbecue.
- Upstate tells a different story: no single style dominates, with light tomato, mustard, and heavy tomato sauces all drawing significant support.
These regional differences help explain why sauce maps of South Carolina often show overlapping zones rather than hard borders—local history, migration, and evolving tastes all play a role in shaping what ends up on the plate.
County-Level BBQ Sauce Preferences
While mustard-based sauce holds the statewide crown, county-level results reveal a rich tapestry of local tastes and traditions. Here's a snapshot of how different counties ranked their favorite BBQ sauces:
Mustard-Based Sauce Dominance
In many counties, mustard-based sauce was the clear favorite:
- Lexington County: Mustard-based sauce ranked first, reflecting the county's strong ties to this traditional style.
- Orangeburg County: Mustard-based sauce led the rankings, showcasing the region's preference for this tangy flavor.
- Newberry County: Mustard-based sauce topped the list, indicating its popularity among local residents.
Vinegar-Based Sauce Preferences
Some counties showed a strong preference for vinegar-based sauces:
- Florence County: Vinegar-based sauce was the top choice, aligning with the Pee Dee region's barbecue traditions.
- Horry County: Vinegar-based sauce led the rankings, reflecting the coastal influence on local tastes.
Light Tomato-Based Sauce Popularity
In certain areas, light tomato-based sauces were favored:
- Abbeville County: Light tomato-based sauce ranked second, indicating a balanced preference among residents.
- Aiken County: Light tomato-based sauce was a close second, showcasing its appeal in the region.
These county-level insights highlight the diverse barbecue sauce preferences across South Carolina, shaped by local traditions and regional influences.
What Sauce Is Most Associated With Your Area?
South Carolinians were asked to name the sauce style most associated with their county and region—not necessarily their favorite, but the one most often found in homes and restaurants around them. The responses reveal deep cultural ties to local BBQ traditions, with strong consensus in some areas and evolving perspectives in others.
Questions Asked: Sauce your COUNTY is most known for, and, in a separate question, Sauce your REGION is most known for. Check the sauce you think is most often used in restaurants and/or homes in your selected [COUNTY or REGION] (depending on the question).
Statewide Patterns
Across the state, mustard-based sauce was the most commonly associated style:
- Mustard-Based Sauce — 52% (Region) | 50% (County)
- Vinegar-Based Sauce — 20% (Region) | 19% (County)
- Light Tomato-Based Sauce — 18% (Region) | 19% (County)
- Heavy Tomato-Based Sauce — 10% (Region) | 11% (County)
- Alabama White Sauce — negligible (
This suggests a general perception that mustard sauce defines much of South Carolina BBQ, though regional and local patterns reveal important nuance.
Regional Standouts
When asked about their region, responses largely mirrored historical expectations:
- Midlands: A landslide for mustard (83%), reaffirming the region's mustard-based identity.
- Lowcountry: Mustard also led here (65%), with vinegar sauce in a distant second (18%).
- Pee Dee: Respondents named vinegar-based sauce most often (70%), reflecting a tradition that aligns more with Eastern North Carolina influences.
- Upstate: No clear consensus—light tomato (33%), heavy tomato (28%), and mustard (28%) were all nearly evenly split, showing how this region straddles historical styles and modern preferences.
County-Level Highlights
At the county level, we see a similar story told in even finer detail:
- Counties with a strong mustard identity included:
- Orangeburg: 80% selected mustard
- Newberry: Over 60%
- Aiken: 61%
- Lexington and Richland counties also leaned heavily mustard, as expected from the Midlands core.
- Counties that identified with vinegar-based sauce:
- Florence, Williamsburg, and Marion Counties in the Pee Dee listed vinegar as most associated with their BBQ traditions.
- Even in the Lowcountry, Berkeley showed strong vinegar support.
- Heaviest support for tomato-based styles came from:
- Anderson County, where heavy tomato was the most cited (44%)
- Pickens and Greenwood counties also showed significant support for light or heavy tomato-based sauces, in line with broader Upstate trends.
Takeaway
While mustard sauce still defines the BBQ identity of much of the state—especially in the Midlands and parts of the Lowcountry—the Pee Dee stands firmly behind vinegar-based sauces, and the Upstate tells a more complex story with no dominant style. County-level insights sharpen the picture, showing how sauce preferences are tightly woven into South Carolina's local culture, often changing just one county over.
A New SC BBQ Sauce Map
For decades, South Carolina’s barbecue identity has been defined by a familiar map.
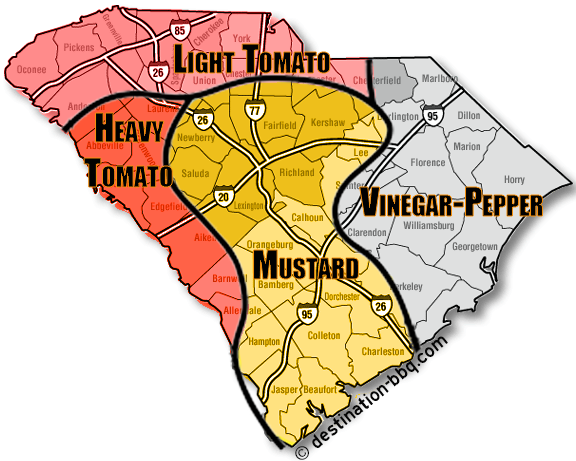
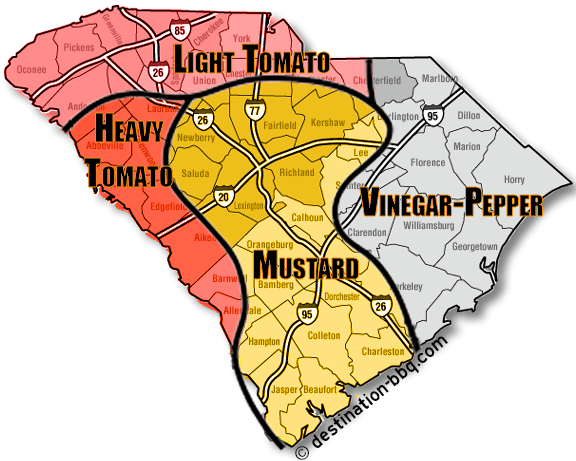
Created in 1987 by University of South Carolina geography professors Charles F. Kovacik and John J. Winberry, the now-classic sauce map divided the state into four distinct regions. Each reflected the most common style of sauce used in local barbecue restaurants at the time. The Midlands became synonymous with mustard, the Pee Dee with vinegar and pepper, the Lowcountry with mustard (but tinged with tomato), and the Upstate with light tomato-based sauces.
The professors’ map, born from years of fieldwork visiting and sampling barbecue across the state, became iconic—perhaps too iconic. As Kovacik later joked to The Wall Street Journal, the sauce map earned “more attention than anything [else] in the damn book.” But while the map captured tradition and restaurant practices of that era, it left out an important question:
What do the people of South Carolina actually prefer on their plates?
That’s where our new map comes in. Based on the results of our statewide survey, this updated view shows each county’s most popular barbecue sauce style as determined by popular vote. Unlike the original, which generalized across wide regions, this new map provides a more detailed, county-by-county look at what South Carolinians say they enjoy most.
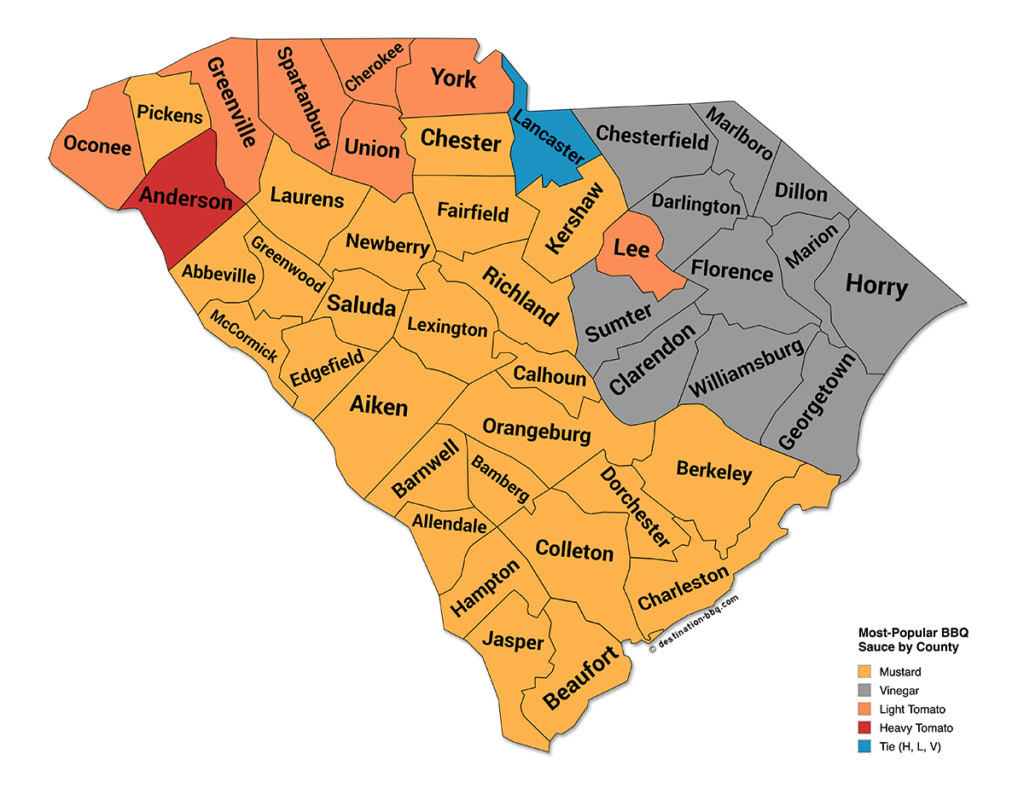
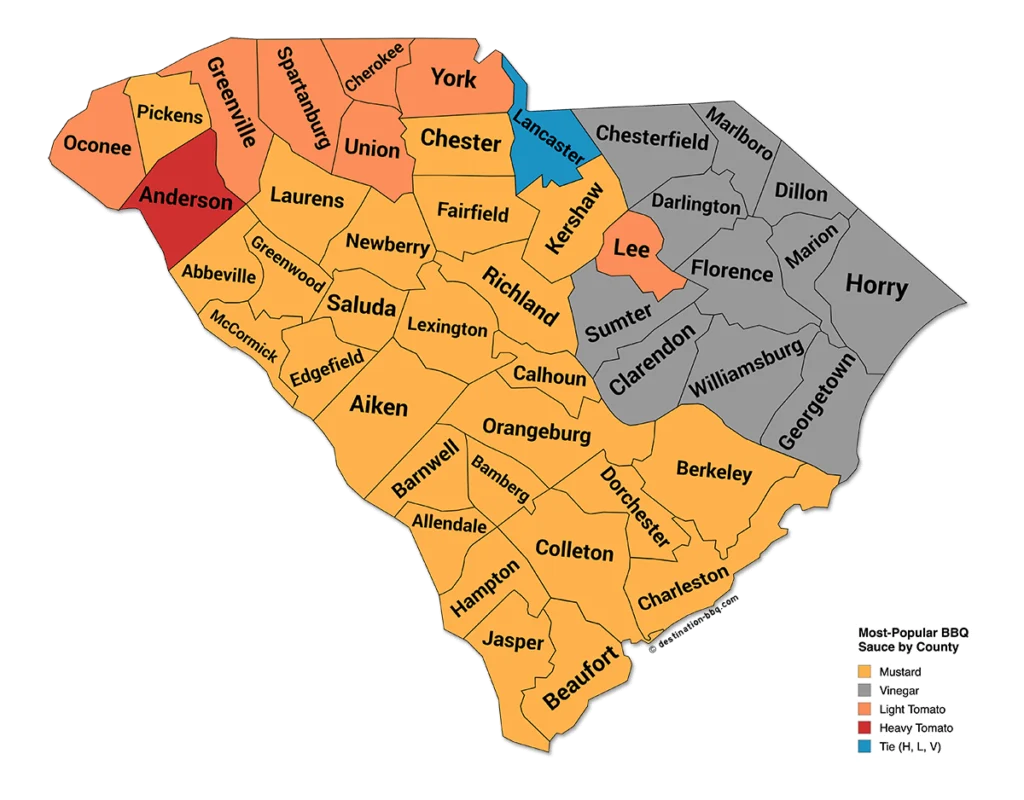
But as with all things barbecue, the reality is more nuanced than it might appear. While the map colors each county according to the sauce style that received the most votes, in many cases the margins were razor-thin. Sometimes, just one vote separated first from second. In places like Lancaster County, no single sauce dominated at all, resulting in a tie.
So while this new map offers a clearer snapshot of present-day preferences, it doesn’t claim to be the final word. Barbecue tastes shift over time. They vary not just by county or town, but sometimes by street or family. What this map does is bring us closer to understanding those shifts—and celebrating the diversity that makes South Carolina barbecue special.
Where South Carolinians Get Their BBQ Sauce
In South Carolina, it’s not just the type of BBQ sauce that sparks debate—it’s also where folks get it. For Question 4, respondents were asked how they usually source their sauce, whether from a bottle, a backyard, or a local BBQ joint.
Question Asked: Where do you typically get your BBQ sauce(s)?
Statewide Results
Across all 1,338 responses, the breakdown was remarkably even at the top:
- 34.4% typically purchase their BBQ sauce at a store
- 33.7% say they make their own
- 25.2% usually buy sauce from a South Carolina BBQ restaurant or vendor
- 5.1% don’t typically buy or make BBQ sauce
- 1.6% chose “Other”—a category that included a variety of responses like friends, farmers markets, or online sources
This data reveals a nearly equal split between DIY and convenience, with a strong showing for supporting local BBQ businesses, especially in certain parts of the state.
Regional Trends
Zooming in by region, distinct preferences begin to emerge:
- Pee Dee residents are the most likely to make their own sauce—with 48% reporting homemade as their typical source.
- Upstate and Lowcountry respondents were more likely to buy sauce at the store—with 39% each opting for retail options.
- Midlands stood out for its support of SC BBQ businesses—30% of respondents here said they buy sauce directly from an SC BBQ vendor or restaurant.
These trends reflect regional culture: Pee Dee’s strong vinegar traditions often begin in home kitchens, while the Upstate and Lowcountry’s growing BBQ scenes have made store-bought sauces more accessible and appealing. The Midlands’ loyalty to local BBQ businesses aligns with its deep-rooted mustard-style heritage.
County-Level Highlights
At the county level, sauce habits are just as telling:
- Aiken County shows a near three-way split: 39% store-bought, 23% homemade, 27% purchased from local BBQ vendors.
- Anderson County leaned more toward store-bought (50%), with the rest fairly evenly divided between homemade and restaurant sources.
- Florence County, like much of the Pee Dee, had a high percentage of residents who make their own sauce, underscoring the area’s homegrown vinegar-based traditions.
Counties with smaller response pools varied widely but still offered insight into local culture and habits.
The Bottom Line
South Carolinians are nearly split between those who make their own BBQ sauce and those who prefer to buy it—either from a store or a trusted local BBQ joint. This blend of tradition and convenience speaks to the state’s living barbecue culture: rooted in the past, but always adapting.
Digging Deeper: Brands, Businesses, and Homemade BBQ Sauce
Depending on how respondents answered Question 4 about where they typically get their BBQ sauce, they were presented with one of three follow-up questions. The responses give us a deeper look at the people behind the preferences—what brands they're loyal to, which SC BBQ joints they support, and what styles they’re crafting in their own kitchens.
A) Store-Bought Sauce: Favorite Brands
Among those who usually buy their sauce at a store, one brand stood above the rest:
- Sweet Baby Ray’s was the most named brand, accounting for 19.5% of all store-bought mentions.
- Maurice’s (9.7%) and Shealy’s (9.2%) followed closely—two brands firmly rooted in South Carolina BBQ tradition.
- Other notable mentions included Stubb’s, Sticky Fingers, and Lillie’s Q.
- A number of responses were variations of “it depends”, indicating that brand loyalty may vary by use or occasion.
Despite the national reach of brands like Sweet Baby Ray’s, the strong showing from local players like Maurice’s and Shealy’s underscores how South Carolinians often seek out familiar flavors—even in the grocery aisle.
B) Restaurant/Vendor Sauce: Where It Comes From
Those who said they typically buy sauce from a South Carolina BBQ restaurant or vendor shared a wide range of sources—nearly 100 different names in all. Still, a few rose to the top:
- Maurice’s led again with 14.2% of these responses.
- Shealy’s came in second at 9.1%
- Dukes, Scott’s BBQ, and Bessinger’s also ranked highly.
Many of the remaining mentions were from beloved local spots—sometimes well-known, sometimes off the beaten path. The diversity of responses here shows the depth of BBQ culture across the state and the trust people place in their hometown pits to concoct the sauce they love most.
C) Homemade Sauce: What’s in the Pot?
For those who prefer to make their own BBQ sauce at home, the styles reflect both tradition and creativity:
- Mustard-based sauces were the most common, made by 43.3% of respondents.
- Vinegar-based sauces came next at 22.7%, followed closely by light tomato styles at 20.3%. (This makes some sense as they share a strong vinegar base. Essentially, each is a vinegar sauce, one without tomato/ketchup and the other without.)
- Heavy tomato (8.4%) and white sauce (3.5%) were far less common but still present.
- A small number of people mentioned unique or fusion styles, such as Japanese BBQ sauce, under “Other.”
These results closely mirror the broader trends across the state—where mustard sauce is king, vinegar holds regional strongholds, and lighter tomato blends appeal to those looking for middle ground. If you'd like to make BBQ sauce at home, we have some great recipes to try:
- Vinegar-based: Rodney Scott’s BBQ Sauce or Dad’s Mop Sauce Recipe
- Mustard-based: Maurice’s Southern Gold, Dukes BBQ Sauce, or Swig & Swine’s Mustard Sauce
- Tomato-based: Gates and Son’s BBQ Sauce or Honey-Hickory Barbecue Sauce
- Mayo-based: Moe’s Original Alabama White Sauce or Home Team’s Alabama White Sauce
- Other: Salsa Verde Recipe for Pulled Pork or Brisket Mojo Sauce
Together, these insights round out the picture of BBQ sauce culture in South Carolina. From grocery shelves to restaurant shelves to kitchen shelves, sauce remains a personal and deeply rooted part of the state’s barbecue identity.
BBQ Sauce in South Carolina: Conclusion
South Carolina’s BBQ sauce landscape is as diverse as its geography. While mustard-based sauces remain the most recognized and widely made, regional loyalties run deep. Vinegar dominates the Pee Dee, mustard holds strong in the Midlands and Lowcountry, and tomato-based styles make quiet but steady inroads in the Upstate.
How South Carolinians get their sauce—whether store-bought, homemade, or from a favorite local joint—reveals just as much about tradition as taste. One thing is clear: sauce here isn’t just an afterthought. It’s history, heritage, and identity—all in a bottle.
Hash and Rice, Slaw and Other Sides: The Essential Complements to South Carolina Barbecue
No BBQ meal in South Carolina is complete without its iconic sides—and SC BBQ hash is at the heart of it all. Whether it’s served over rice, on bread, or eaten by itself, hash plays a key role in defining the state’s BBQ culture. Yet, it’s not the only dish that graces the plate. From creamy mac-and-cheese to tangy slaw, savory collard greens, and beyond, sides are an integral part of the BBQ experience.
In this section, we’ll explore the state’s favorite ways to enjoy hash and the sides that most often accompany BBQ. We’ll dive into the statewide preferences, regional variations, and unique county-level insights, highlighting how South Carolinians across different areas put their own spin on the classic BBQ plate. Whether you're a rice-on-bottom purist or prefer hash served alone, the diversity in these responses paints a colorful picture of the sides that make South Carolina BBQ a one-of-a-kind experience.
Hash: What’s Your Favorite Type?
Hash has deep roots in South Carolina BBQ, but opinions vary on whether you reach first for pork, beef, or something else. (Because hash is so important in SC, we created the interactive SC Hash Map.) Here’s how our responses broke down.
Question Asked: Hash: Favorite Type(s)
Statewide Results
Out of 1,423 respondents:
- Pork Hash: 62.4% (888 responses)
- Beef Hash: 14.3% (203 responses)
- I don’t like hash: 13.9% (198 responses)
- Liver Hash: 9.0% (128 responses)
- Other: 0.4% (6 responses)
Regional Breakdown
| Table 10 | |||||
| Region | Pork Hash | Beef Hash | I don’t like hash | Liver Hash | Other |
| Lowcountry | 75.4% | 5.5% | 12.3% | 6.8% | 0.0% |
| Midlands | 76.9% | 7.0% | 9.6% | 6.3% | 0.2% |
| Pee Dee | 44.4% | 5.8% | 20.0% | 28.9% | 0.9% |
| Upstate | 44.6% | 34.7% | 17.0% | 2.7% | 1.0% |
What It Tells Us
Pork hash is the clear favorite statewide, with roughly six in ten respondents choosing it. In both the Lowcountry and Midlands, three-quarters of fans stick with the classic pork-based gravy. By contrast, the Pee Dee shows the widest spread of tastes: while 44.4% still reach for pork hash, nearly 29% pick liver hash and one in five say they don’t eat hash at all. The Upstate stands out for its love of beef hash—34.7%—with pork not far ahead.
County Highlights
- Marion County: Led the state in liver hash preference, with 40.0% choosing Liver Hash—well above the Pee Dee average.
- Cherokee County: Reported a unanimous 100% favoring Beef Hash, underscoring the Upstate’s beef‐centric tradition, although the number of responses from the county was low.
- Jasper County: Had the highest share of hash skeptics, with 60.0% saying “I don’t like hash.”
- Dillon County: Saw 55.6% of respondents opt out—also highlighting pockets where hash isn’t on the plate.
- Greenville County: 59.9% chose Pork Hash and 19.7% chose Beef Hash, showing a stronger pork preference than the regional average.
These county‐level call-outs show how local tastes can diverge from the statewide trend—pork hash still reigns, but beef and liver find passionate followings in their home regions, while some locales simply skip hash altogether.
Hash: How do You Prefer to Eat It?
Hash may be the star of the plate, but how do South Carolinians actually eat it? We asked whether hash belongs over rice, on bread, served by itself, or skipped altogether.
Question Asked: I most often eat hash...
Statewide Results
Out of 1,335 respondents:
- Over rice: 75% (1,000 responses)
- I don’t eat hash: 15% (198 responses)
- By itself: 6% (77 responses)
- On bread: 4% (60 responses)
Regional Breakdown
| Table 11 | ||||
| Region | Over rice | I don’t eat hash | By itself | On bread |
| Lowcountry | 81.6% | 11.4% | 5.7% | 1.3% |
| Midlands | 87.1% | 9.6% | 2.2% | 1.1% |
| Pee Dee | 72.6% | 21.6% | 2.9% | 2.9% |
| Upstate | 56.6% | 20.1% | 11.5% | 11.8% |
What It Tells Us
Statewide, three-quarters of hash lovers put it over rice—South Carolina’s signature pairing. Only a small share prefers hash on bread or served alone, and 15% skip hash entirely. Regionally, the Midlands leads in the classic rice combo (87.1%), while the Upstate shows a much more mixed approach: less than 60% stick to rice, and more than one in five opt to skip hash. The Pee Dee has the highest skip rate (21.6%), hinting at pockets where hash takes a back seat.
County Highlights
- Hampton County: 100% of respondents enjoy hash over rice, the strongest rice loyalty in the state, though with only 4 respondents representing the county, the data is limited
- Dillon County: 62.5% say they don’t eat hash, marking the highest skip rate.
- Union County: 40.0% prefer hash on bread, the highest share for a bread-based serving.
- Cherokee County: 20.0% eat their hash by itself, leading all counties in the “served solo” category.
- Note: each of these counties had a low number of respondents.
These details show that while rice remains king, taste and traditions shift from county to county—even influencing whether hash ends up on the plate at all.
If you're interested in cooking your own hash at home, consider these recipes:
Pick your Side(s)
Sides are more than just an afterthought—they complete the BBQ experience, balancing smoky meat with cool, creamy, or savory accompaniments. From classic slaw to comforting mac-and-cheese, South Carolinians know that the real magic happens when a heaping scoop of ‘cue meets the perfect side. Here’s how the state stacks up on its favorite plate partners.
Question Asked: When eating BBQ, the sides I most often find on my plate are... (select all that apply)
Statewide Snapshot
Across 1,260 respondents (who selected at least one side), these five dishes topped the list:
| Table 12 | |
| Side | % of Plates (n) |
| Slaw | 54% (681) |
| Macaroni and cheese | 47% (592) |
| Baked beans | 43% (542) |
| Hash | 40% (510) |
| Collard greens | 36% (452) |
Despite regional twists, slaw remains the undeniable champion—on more than half of all plates—followed closely by creamy mac-and-cheese. Baked beans and hash pull in a solid 40-plus percent share, while collard greens round out the top five.
Regional Flavors
Dig a little deeper, and you’ll see each corner of South Carolina adds its own spin:
| Table 13 | |||||
| Region | Slaw | Mac & Cheese | Baked Beans | Hash | Collards |
| Lowcountry | 60.1% | 47.8% | 40.3% | 44.0% | 44.0% |
| Midlands | 52.2% | 47.0% | 42.1% | 54.8% | 32.6% |
| Pee Dee | 56.0% | 47.2% | 32.6% | 32.6% | 37.8% |
| Upstate | 49.4% | 46.0% | 51.7% | 24.3% | 31.4% |
- Lowcountry: Slaw loyalty peaks here (60%), matched by a not surprisingly high hash share (44%), reflecting its rice-and-hash heritage.
- Midlands: Hash reigns supreme at 54.8%, with mac & cheese matching its statewide weight.
- Pee Dee: A more moderate plate—slaw and mac-and-cheese hold steady, but hash and beans dip below half.
- Upstate: Beans take center stage (51.7%), while hash falls to just 24.3%, showing a northern fondness for the classics.
County Highlights
Some counties show clear local favorites when it comes to BBQ sides, offering a window into regional tastes:
- Greenville County: Baked beans appeared on 47.9% of plates (57 of 119), making them the top choice in the state’s most populous county.
- Aiken County: Hush puppies showed up on 64.0% of plates (32 of 50), ranking among the highest in South Carolina.
- Florence County: Chicken bog or “perlo” appeared on 54.2% of plates (26 of 48), underscoring the Pee Dee’s love of this traditional dish.
- Pickens County: Fried okra appeared on 51.4% of plates (18 of 35), highlighting a standout Upstate side.
- Orangeburg County: Slaw appeared on 66.7% of plates (24 of 36), reflecting a strong local preference in this mustard‑sauce BBQ region.
These county highlights remind us that while slaw, mac-and-cheese, and baked beans form the backbone of most BBQ plates statewide, local communities often elevate their own signature sides, making each county’s table just a little bit different.
Hash and Sides: Conclusion
Across every corner of South Carolina, hash and sides remain inseparable from a true BBQ plate—but the way they show up varies in telling ways. Statewide, pork hash leads by a mile, “over rice” reigns supreme as the preferred serving style, and slaw, mac‑and‑cheese, and baked beans anchor more than half of all plates.
Yet when you zoom in, local traditions emerge: the Pee Dee leans harder on liver hash and sees more folks skipping hash altogether; the Upstate champions beef hash and gives baked beans a starring role; the Midlands doubles down on hash‑topped rice; and the Lowcountry’s plates often carry both slaw and hash in near‑equal measure.
County call‑outs bring those differences into sharper focus—Greenville County’s baked beans appear on 47.9% of plates, Aiken County’s hush puppies on 64.0%, Florence County’s chicken bog on 54.2%, Pickens County’s fried okra on 51.4%, and Orangeburg County’s slaw on 66.7%—all reminding us that barbecue sides aren’t one‑size‑fits‑all.
Taken together, these patterns show how South Carolinians put their personal stamp on the BBQ experience. Whether piled high over rice, plopped beside pulled pork, or served solo, hash and its supporting cast of sides tell a story of rich regional flavor, deep‑rooted tradition, and plate‑by‑plate creativity.
SC BBQ Restaurants: Dining Habits, Spending, Health Choices, and Your Favorites
South Carolinians take their restaurant-served barbecue seriously, whether it’s a monthly treat or a weekly ritual. In this section, we explore:
- How often diners head out for smoked meats
- What they value most in a BBQ joint (from wood-cooked flavor to meat selection and sides)
- Per-person spending expectations
- The role of health or dietary concerns in choosing and timing visits
- Which restaurants top the list at the state, regional, county, and hearsay levels
Together, these findings offer a comprehensive look at where—and why—people across the Palmetto State seek out their next plate of baby back ribs, pulled pork, or maybe even some brisket.
Often, as well find out later, those seeking a place to dine will avail themselves of the directory of BBQ restaurants in South Carolina or the interactive SC BBQ Trail Map. And you can always download the official SC BBQ Trial Map.
Dining Frequency at BBQ Restaurants
When it comes to heading out for smoked meats, most South Carolinians fall into a monthly rhythm rather than a weekly routine. Here’s the breakdown at a glance:
Question Asked: On average, about how often do you eat BBQ at or FROM A RESTAURANT?
Statewide Results
- 36% dine out a couple of times each month
- 30% visit about once a month
- 23% eat barbecue at a restaurant fewer than 12 times a year (“rarely”)
- 9% make it a weekly outing
- 1% almost never—or never—eat barbecue at a restaurant
Regional Highlights
- Upstate leads the state in regular outings: 38% go out for BBQ a couple times monthly (vs. 36% statewide) and 13% make it a weekly habit—nearly half again the statewide weekly rate of 9%.
- In the Pee Dee, 37% dine out a couple times each month, and 11% go weekly, reflecting strong local barbecue culture.
- Lowcountry households tend toward monthly visits: 35% couple-times-a-month and 35% once a month, with just 9% going weekly.
- Midlands residents are the most cautious about restaurant visits: only 34% go a couple times a month and just 6% weekly, while 28% fall into the “rarely” category—higher than any other region.
County Highlights
- Sumter County stands out for restaurant loyalty: more than one in five diners (21%) grab BBQ weekly—well above the state’s 9%—and 26% head out a couple times a month.
- At the opposite end, Marlboro County shows a more sporadic appetite: two-thirds of respondents (67%) said they dine out on barbecue fewer than 12 times a year, suggesting many stick to home-cooked meals or road-trip joints.
- Anderson County mirrors strong engagement, with 44% going out a couple times monthly and 18% weekly.
- Chesterfield County, by contrast, sees 45% falling into the “rarely” category, indicating less frequent restaurant BBQ visits compared with statewide norms.
These patterns suggest that while enjoying a plate of ribs or pulled pork at a restaurant is a regular treat for many South Carolinians, frequency varies considerably by region—and even more so by county—reflecting local traditions, availability, and personal habits.
What South Carolinians Value in a BBQ Restaurant
When asked to pick their top 3 qualities in a barbecue restaurant, diners prioritized:
Question Asked: Things you value most in a BBQ restaurant (Select top 3):
Statewide Results
- Meat options: 61%
- Wood-cooked barbecue: 49%
- Side dishes: 41%
- Sauce options: 37%
- Hash: 33%
- Tradition: 29%
- Location: 20%
- Price: 20%
- Customer service: 19%
Regional Highlights
- Upstate residents prize meat options most of all (65% vs. 61% statewide) and place side dishes (45%) and wood-cooked (51%) in their top three.
- In the Pee Dee, wood-cooked jumps to 55%—the highest regional score for that attribute—while meat options (53%) and side dishes (38%) fill out the top three.
- Lowcountry voters fall in line with the statewide order: meat options (61%), wood-cooked (47%), and side dishes (41%).
- The Midlands mirror the state pattern as well, with 60% valuing meat options, 47% wood-cooked, and 40% side dishes.
County Highlights
- Bamberg County leads the state for side-dish devotion, with 75% of diners ranking sides in their top three—nearly double the statewide rate of 41%.
- Spartanburg County shows the strongest hunger for variety: roughly two-thirds of respondents here include meat options among their top three, well above the statewide 61%.
- Cherokee County stands out for its love of authentic smoke—58% of diners name wood-cooked barbecue as a top priority, compared with 49% statewide.
- Richland County offers a picture of the “average” urban palate, closely matching statewide patterns: about 61%meat options, 49% wood-cooked, and 42% side dishes all make the cut here.
The Bottom Line
- Top Priorities: Meat variety (61%), wood-cooked flavor (49%), and side dishes (41%) consistently lead the pack.
- Middle Tier: Sauces (37%), hash (33%), and tradition (29%) round out the core must-haves.
- Lower Concerns: Location (20%), price (20%), and customer service (19%) sit at the bottom—showing that most barbecue lovers are willing to look past cost or service quirks in favor of great smoke, meats, and sides.
- Local Nuances: Certain counties lean heavily into one attribute (e.g., Bamberg’s love of sides, Cherokee’s wood-smoke devotion), but almost every community still reflects the statewide love of meat selection and authentic, wood-smoked barbecue.
Spending Habits in SC BBQ Restaurants
How much do South Carolinians typically spend on a barbecue meal (food, drinks, tips included)? Respondents chose from four price brackets. Here’s what we found:
Question Asked: PER PERSON: Amount you'd guess you typically spend on a meal at a SC BBQ restaurant? (including all food/bev and any tips)
Statewide Results
Across all 1,318 completed responses, spending clusters in the middle:
- 48.3% spend $16–20 per person
- 27.4% spend $10–15
- 23.5% spend $21–25
- 0.5% spend less than $10
Regional Trends
- Midlands & Pee Dee are the most consistent mid-range diners, with 53% (Midlands) and 52% (Pee Dee) reporting checks of $16–20.
- Lowcountry shows the greatest willingness to stretch for higher-end plates: 34% spend $21–25—well above the statewide 24%—while 44% stay in the $16–20 bracket.
- Upstate balances between mid-range and higher checks: 44% spend $16–20 and 26% $21–25, with 29% at $10–15.
County-Level Highlights
(only counties with ≥10 respondents included)
- Lancaster County: A standout outlier—64% of diners typically spend $21–25 per person, more than double the statewide rate of 24%.
- Larger, well-sampled counties (e.g., Charleston, Richland, Greenville, Beaufort):
- Roughly 45–55% spend $16–20
- 20–30% split between $10–15 and $21–25
- Negligible share (
- No other county with a solid sample size shows a majority outside the $16–20 bracket, underscoring that mid-range spending is the norm across most of South Carolina.
The Bottom Line
Across South Carolina, the sweet spot for a barbecue outing remains $16–20 per person, chosen by nearly half of diners. In fact, in well‑sampled counties like Charleston (42%), Beaufort (39%), Greenville (42%), and Richland (59%), you’ll find roughly 40–60% of diners sticking to that same mid‑range check. The one county that truly bucks the trend is Lancaster, where 64% typically stretch into the $21–25 bracket. Outside of that standout, no other county sees a majority spending above or below $16–20, which shows that moderate spending expectations hold firm from the mountains to the coast.
Impact of Health Concerns on Restaurant Choice
Do health and dietary concerns play distinct roles in South Carolinians’ BBQ habits? Can these issues shape where people go or how often they go? Here’s what we found out:
Questions Asked: Do health/dietary concerns or choices impact WHICH RESTAURANT you choose to visit? And additionally, Do health/dietary concerns or choices impact HOW OFTEN you choose to eat at a SC BBQ restaurant?
Statewide Results
- Which restaurant?
- 9% of respondents (126 of 1,335) say health or dietary choices impact which BBQ spot they pick; 91% say it does not.
- How often?
- 22% of respondents (300 of 1,339) let health or dietary concerns influence how often they eat out for barbecue; 78% say frequency is unaffected.
Bottom Line: Dietary factors are more than twice as likely to curb frequency (22%) as to dictate choice of restaurant (9%).
Regional Trends
| Table 14 | ||
| Region | “Which” Affected (Yes) | “How Often” Affected (Yes) |
| Lowcountry | 14% | 28% |
| Upstate | 11% | 24% |
| Midlands | 7% | 20% |
| Pee Dee | 6% | 15% |
- The Lowcountry shows the highest sensitivity in both categories—14% alter their choice and 28% adjust frequency for dietary reasons.
- Pee Dee residents are least likely to let diet guide their barbecue outings (6% on choice, 15% on frequency).
County-Level Highlights
- Impact on Which Restaurant
- Spartanburg County: 20%
- Cherokee & Jasper Counties: 20% each
- Dorchester County: 19%
- Beaufort County: 17%
- Impact on How Often
- Chester County: 50%
- Orangeburg County: 36%
- Hampton County: 33%
- Greenville County: 30%
In most of South Carolina, flavor, tradition, and convenience outweigh nutritional considerations when choosing a BBQ restaurant—and a clear majority of diners don’t let health concerns cut into their BBQ outings. Still, a significant minority—especially in certain counties, albeit some with fewer respondents—do adjust how often they indulge, highlighting pockets where dietary needs shape local BBQ culture.
Favorite BBQ Restaurants
When South Carolinians name their top barbecue spots, loyalties vary wildly—from regional powerhouses to home-town champions to the brands you hear about most. Here’s how each question breaks down.
- Overall Favorite in South Carolina
Question Asked: Name your overall favorite SC BBQ restaurant: (from ANY PART of the state)
Among 1,263 valid responses, no single restaurant dominates—votes are spread across dozens of shops:
- Dukes BBQ earns the most mentions at 10.6% (134 votes).*
- *Because “Dukes BBQ” refers to an historically family-connected brand across nine independently owned locations (mainly in the Midlands and Lowcountry), these votes reflect brand affinity more than one particular restaurant. Respondents generally didn’t specify which Dukes restaurant they were voting for.
- Scott’s Bar-B-Que follows with 8.3% (105 votes).
- Lewis Barbecue lands at 7.4% (94 votes).
- Shealy’s claims 5.9% (75 votes).
- Smokin’ Pig rounds out the top five at 4.9% (62 votes)
- Maurice’s Piggie Park – 48 votes (3.80%)
- Rodney Scott's BBQ – 41 votes (3.25%)
- McCabe’s BBQ – 36 votes (2.85%)
- Brown’s BBQ – 33 votes (2.61%)
- Sweatman’s BBQ – 26 votes (2.06%)
Together, the top ten spots account for only about 52% of all 1,263 votes—showing that just over half of respondents gravitate toward these ten names, while the rest are scattered across dozens of other favorites.
2. Regional Favorites
Question Asked: Name your favorite SC BBQ restaurant: (from the REGION you selected; may be the same as above or not)
Each part of the state has its own front-runner (n≈260–450 per region):
- Lowcountry: Dukes BBQ* leads with 22.3%, ahead of Lewis Barbecue (16.0%) and Rodney Scott’s BBQ (9.7%).
- *Remember: “Dukes BBQ” here represents the brand across nine independently owned locations, not one single address.
- Midlands: Shealy’s tops the region at 15.6%, followed by Maurice’s Piggy Park (13.5%) and Dukes BBQ* (11.1%).
- Pee Dee: Scott’s BBQ dominates with 26.0%, with McCabe’s BBQ (10.2%) and Shuler’s BBQ (9.8%) trailing.
- Upstate: Smokin’ Pig leads at 21.6%, ahead of Lewis Barbecue (12.6%) and Henry’s Smokehouse (9.6%).
These results show clear “home-region” favorites, from Scott’s stronghold in the Pee Dee to Smokin’ Pig’s Upstate base, with the Dukes BBQ family of restaurants being strong from the Midlands to the Lowcountry.
3. County-Level Champions
Question Asked: Name your favorite SC BBQ restaurant: (from the COUNTY you selected; may be the same as above or not)
In less-populated counties, a single restaurant can enjoy unanimous support; in larger counties, the leader often holds only a modest share:
- Unanimous champions (100%): Hogg Heaven for folks in Allendale; Buttermilk's in Chester; Shuler’s in Marion. Note: each of these counties included fewer than 5 respondents, Allendale with only 1.
- Strong majorities: Shuler’s in Dillon (87.5%); Dukes BBQ in Bamberg (75%).
- Fragmented fields: In Oconee County, Big D’s leads with just 13.3%; while in Fairfield County Doko Smoke tops at only 14.3%.
Across all 46 counties, the Dukes BBQ brand emerges most often (4 counties) as the county favorite, but dozens of other restaurants each lead in one or two counties—painting a patchwork of local loyalties.
4. “Heard-Best” Reputation Picks
Question Asked: Despite your personal opinion, what SC barbecue restaurant do you often hear is the best in the Palmetto State?
When asked which restaurant they consistently hear is the state’s best (n=1,086), respondents pointed most often to:
- Scott’s Bar-B-Que – 26.8%
- Rodney Scott’s BBQ – 13.7%
- Lewis Barbecue – 11.6%
- Dukes BBQ – 9.3%*
- Shealy’s – 7.7%
Unlike personal favorites, this reputation-based question yields a clear frontrunner. Scott’s Bar-B-Que alone accounts for more than one in four mentions, suggesting a powerful word-of-mouth presence.
What This Tells Us
Personal loyalties in South Carolina are remarkably dispersed—no single address dominates statewide or in most counties. Yet each region and many counties still rally around a clear favorite. And when it comes to reputation, a handful of names (especially the two Scott’s brands) rise above the rest. The Dukes BBQ “brand effect” also deserves an asterisk wherever it appears, since it reflects collective recognition of nine related but independently run restaurants.
SC BBQ Restaurants: Conclusion
Across all measures—from how often people dine out for barbecue to which pitmasters earn the loudest cheers—one theme stands out: South Carolina’s barbecue scene is as varied as the people who love it. Most diners make a monthly pilgrimage to their favorite smokehouse, prioritizing a broad selection of meats and authentic, wood-cooked flavor. They plan to spend roughly $16–20 per person, and while diet or health concerns rarely dictate where they go, they do sometimes influence how often they indulge.
When it comes to naming a favorite, loyalties shift with geography: the Dukes BBQ brand across the Lowcountry, Shealy’s in the Midlands, Scott’s in the Pee Dee, and Smokin’ Pig Upstate. At the county level, home-town heroes can earn unanimous support, yet larger markets remain delightfully fragmented. And though personal picks scatter across dozens of addresses, reputation concentrates around a few marquee names—Scott’s Bar-B-Que leads the chatter, followed by Rodney Scott’s, Lewis, and the Dukes brand.
Taken together, these results paint a portrait of a living barbecue culture—rooted in regional traditions, shaped by local champions, and united by the shared love of hickory smoke, savory sides, and good company. Whether you’re plotting your next road trip or mapping out a bucket list, this data offers a clear guide to where to find the best of South Carolina’s smoked meats.
Backyard BBQ in South Carolina: Cooking Methods, Equipment, and Regional Traditions
In South Carolina, barbecue isn’t just a meal—it’s a way of life. Whether it’s the thrill of slow-cooking a whole hog over a bed of coals from a burn barrel or firing up a pellet grill for a perfectly smoked brisket, South Carolinians have strong opinions and traditions when it comes to preparing barbecue.
In this section, we’ll explore the tools, meats, and fuels that people rely on when cooking their own BBQ at home. From regional preferences to county-specific nuances, we’ll uncover what makes South Carolina’s BBQ culture so diverse and deeply rooted in local flavors.
Cook your own barbecue?
Cooking your own barbecue—beyond just grilling burgers or hot dogs—is a common pastime in South Carolina. Here’s how the responses break down:
Question Asked: Do you sometimes cook your own barbecue? (that does NOT mean grilling hot dogs, hamburgers, etc)
Statewide Results
Overall, 79 percent of respondents (1,057 of 1,333) say they sometimes cook their own barbecue at home.
Regional Highlights
Across the state’s four regions, home BBQ cooking remains strong:
- Pee Dee: 82.6 percent
- Lowcountry: 80.0 percent
- Midlands: 79.5 percent
- Upstate: 76.7 percent
County Highlights
At the county level, some areas report universal participation, while others fall below the statewide average:
County Highlights (≥ 10 respondents only)
- Universal participation (100 percent Yes): Colleton, Calhoun
- Lowest rates ( Williamsburg (66.7 percent), Anderson (69.4 percent), Pickens (69.2 percent)
Note: Other counties reached 100 percent or dipped below 70 percent, but had fewer than 10 respondents and are excluded here for stability.
Key Takeaways
- A clear majority of South Carolinians (nearly 4 in 5) cook their own BBQ at home.
- The Pee Dee and Lowcountry lead the state in home barbecue activity.
- Among counties with robust samples, Colleton and Calhoun stand out for universal participation, though we’re confident a larger sample size would reduce the overall percentage below 100.
- Williamsburg, Anderson, and Pickens fall noticeably below the statewide rate, possibly suggesting more reliance on commercial BBQ in those areas.
Final Thoughts
Cooking your own barbecue is deeply ingrained across much of South Carolina, with especially high engagement in the Pee Dee and Lowcountry. While nearly every home cook in Colleton and Calhoun (at least those who took part in the survey) takes charge of their barbecue, counties like Williamsburg, Anderson, and Pickens appear more likely to leave the slow-smoked meats to local restaurants and vendors.
Home BBQ Setup: Equipment, Meats, and Fuel
To dive deeper into at-home cooking practices, we followed up with the 1,057 respondents who said they sometimes cook their own BBQ. We asked about three key areas—cooking and smoking equipment, preferred meats, and primary fuel sources—and allowed each person to select all options that applied. This approach gives a full picture of the rigs, proteins, and fuels powering DIY BBQ across South Carolina.
Note: These questions allowed multiple selections, so each percentage shows the share of at-home cooks who included that option among their picks—totals will often sum to more than 100%. In practice, one person might use both a smoker and a pellet grill (and pick both), or favor pork cuts and chicken together. Rather than interpreting these figures as slices of a single “pie,” read them as independent popularity scores: they tell you how many cooks rely on each tool, meat, or fuel, without excluding any others. This way, you can see which items are most widespread, even when they overlap.
Cooking/Smoking Equipment
DIY BBQ cooks in South Carolina use a variety of rigs—from modern pellet grills to time-honored smoker pits. Here’s how the favorites stack up:
Question Asked: Which of the following do you typically use to cook/smoke your barbecue? (select all that apply)
Statewide Results
- Smoker: 50.6%
- Pellet grill: 29.9%
- Charcoal grill: 23.2%
- Gas grill: 15.6%
- Egg-style grill: 12.9%
- (Remaining methods: concrete pits, hole-in-the-ground, and other unique setups were each cited by fewer than 7% of respondents.)
Regional Highlights
- Upstate: Smokers dominate (55.8%), with pellet grills a solid second (33.7%).
- Midlands: Half of home cooks use a smoker (50.6%), and 28.5% own a pellet grill.
- Lowcountry: 49.2% rely on smokers, while charcoal grills (22.9%) edge gas (21.2%) by a hair.
- Pee Dee: Smokers lead but at a lower 43.8%, and pellet grills nearly match at 29.0%. Concrete pits are strongest here (10.7%).
County Highlights
- Smoker: Colleton – 90.0%
- Pellet grill: Union (57.1%), Spartanburg (52.3%), Clarendon (50.0%)
- Charcoal grill: Cherokee (42.9%), Fairfield (41.7%), Edgefield (40.0%)
- Gas grill: Chesterfield (60.0%), Williamsburg (42.9%), Beaufort (42.9%)
- Concrete pit: Williamsburg (35.7%), Calhoun (20.0%), Chesterfield (20.0%)
- Hole-in-the-ground: Edgefield (10.0%), Greenwood (10.0%), Newberry (9.1%)
Key Takeaways
- Smokers remain the backbone of home BBQ, chosen by half of all DIY cooks and leading every region—even the Pee Dee where adoption dips to 43.8%. Their dominance underscores the state’s deep-smoke traditions.
- Pellet grills are carving out a strong secondary niche (29.9%), especially in competition-influenced areas like the Upstate (33.7%) and Union County (57.1%), suggesting that cooks value precise temperature control and set-and-forget convenience.
- Charcoal retains broad appeal (23.2%) among cooks who prize flavor nuance but may lack a dedicated smoker, with counties such as Cherokee and Fairfield showing continued kettle-grill loyalty.
- Gas and egg-style grills fill specialized roles, servicing cooks who prioritize speed, portability, or versatility—seen most in Chesterfield’s gas-grill devotees and the Upstate’s egg-style aficionados.
- Concrete-pit and ground-pit methods persist in rural pockets, notably Williamsburg and Edgefield, reflecting living links to communal whole-hog and pit-cooking traditions despite representing fewer than 7% statewide.
- Many cooks blend multiple rigs, pairing smokers with pellet or charcoal units to suit different meats and occasions—highlighting a flexible, hybrid approach rather than single-tool reliance.
Equipment: Final Thoughts
South Carolina’s home-cooked BBQ gear palette marries heritage with innovation. While traditional smokers anchor the practice, pellet grills surge in tech-savvy communities, and charcoal kettles hold their own where full smokers aren’t practical.
Gas and egg-style grills serve convenience-seeking cooks, and the survival of concrete and ground pits in rural counties preserves age-old communal cooking styles. Together, this equipment mix reveals a BBQ culture that honors its deep-smoke roots while eagerly adopting new tools to master flavor, temperature, and ease.
Meat(s) of Choice
Home cooks in South Carolina lean heavily on pork, but a range of meats make their way onto backyard smokers and grills. Here’s the breakdown:
Question Asked: What meat(s) do you typically use for your BBQ? (select all that apply)
Statewide Results
- Pork cuts (butts, shoulders, etc.): 90.4%
- Pork ribs: 59.6%
- Chicken: 48.6%
- Brisket: 31.2%
- Sausage: 17.2%
- Beef ribs: 14.5%
- Whole hog: 14.0%
- Turkey: 11.4%
- Other (fish, tri-tip, rabbit, alligator, etc.): each under 1%
Regional Highlights
- Lowcountry: Pork cuts (89.6%), pork ribs (56.7%), chicken (50.8%)
- Midlands: Pork cuts (91.6%), pork ribs (60.0%), chicken (50.1%)
- Pee Dee: Pork cuts (87.7%), pork ribs (56.7%), chicken (36.8%); whole-hog cooks are more common here (28.7%)
- Upstate: Pork cuts (91.3%), pork ribs (63.3%), chicken (51.8%); brisket peaks at 36.7%
County Highlights
- Pork cuts (butts, etc.): Abbeville (100% selected this option)
- Pork ribs: Laurens (87.5%)
- Chicken: Edgefield (90%)
- Brisket: Greenwood (50%)
- Whole hog: Williamsburg (57.1%)
- Sausage: Barnwell (41.7%)
- Turkey: Greenwood (30%)
- Beef ribs: Laurens (43.8%)
Key Takeaways
- Pork cuts are the unshakeable foundation of home BBQ, with virtually every DIY cook—including a slight dip in the Pee Dee—leaning on butts and shoulders as their go-to option.
- Secondary favorites split by region: pork ribs and chicken form the broad “next tier,” but brisket finds especially strong footing in the Upstate—suggesting influence from competition-style and Texas-inspired cooks.
- Whole-hog traditions persist in rural cores like Williamsburg and the Pee Dee, where communal events and multi-family gatherings keep that all-in-one approach alive.
- Niche proteins carve out local niches: Greenwood’s above-average brisket and turkey use point to its eclectic home kitchens, while Barnwell’s sausage devotees possibly reflect a unique link to sausage-making traditions.
- “Other” meats, though under 1% statewide, hint at adventurous cooks experimenting with everything from fish to game, underscoring a willingness to push beyond familiar flavors.
Meats: Final Thoughts
South Carolina’s backyard BBQ shows a strong heartbeat of tradition—pork cuts reign supreme—while regional nuances and niche proteins add layers of local character. The Upstate’s brisket boost, the Pee Dee’s whole-hog loyalty, and Barnwell’s sausage surge all reveal how community gatherings, family recipes, and outside influences intersect at the home pit.
Together, these patterns illustrate a BBQ culture that honors its roots yet continues to diversify and evolve, a tradition we celebrated in Going Whole Hog.
What Fuels the Fire?
Fuel choice shapes the flavor of home-cooked BBQ, and South Carolinians draw on everything from seasoned hardwood to modern electric burners. (For those considering wood, be sure to check out our BBQ Wood Selector.) Here’s how the responses fall:
Question Asked: What is your primary fuel source? (select all that apply)
Statewide Results
- Wood: 39.4%
- Charcoal: 39.1%
- Pellets: 33.3%
- Gas: 20.4%
- Electric: 13.4%
- Other (coals, lump coal, etc.):
Regional Highlights
- Upstate: Wood leads at 43.7%, with charcoal close behind at 42.3%.
- Midlands: Wood (40.5%) edges charcoal (39.9%), and pellets sit at 33.7%.
- Lowcountry: Charcoal tops at 34.9%, followed by wood (33.6%) and pellets (30.7%).
- Pee Dee: Wood and charcoal are tied at 38.0%, then pellets at 29.8% and gas at 27.5%.
County Highlights
- Wood use: Cherokee leads at 71.4%.
- Charcoal grills: Williamsburg at 50.0%—the highest among larger-sample counties.
- Pellet grills: Union (71.4%), Lancaster (54.6%), Spartanburg (52.3%).
- Gas grills: Chesterfield (60.0%), with Williamsburg and Beaufort both at 42.9%.
- Electric grills: Orangeburg (30.0%), Calhoun (30.0%), Pickens (29.6%).
Key Takeaways
- Wood and charcoal share the crown: Nearly four in ten home cooks use wood (39.4%) and almost as many choose charcoal (39.1%), reflecting a balance between hardwood smoking traditions and the convenience of charcoal kettles.
- Pellets signal a modern shift: One in three DIY cooks (33.3%) favors pellets, with especially high adoption in the Upstate (37.0%) and Midlands (33.7%)—regions where precision temperature control and ease of use resonate with seasoned and newer enthusiasts alike.
- Gas and electric serve convenience needs: Gas (20.4%) and electric (13.4%) fuels are less common but hold strong in areas prioritizing speed and simplicity—most notably gas in the Pee Dee (27.5%) and electric in the Lowcountry (17.2%).
- Fuel aligns with equipment: Counties with 100% smoker use (Allendale, McCormick, Marion) lean heavily on wood and charcoal, while pellet-grill leaders like Union (71.4%) obviously pair pellets with their rigs. Egg-style grill enthusiasts—particularly in the Upstate—overwhelmingly choose charcoal to heat their ceramic cookers.
- Rural traditions endure: Although concrete pits and hole-in-the-ground methods each account for under 7% statewide, they still emerge in pockets such as Williamsburg (concrete pit 35.7%) and Saluda (ground pit 11.1%), underscoring living links to early BBQ roots.
Fuel: Final Thoughts
South Carolina’s BBQ fuel choices weave together heritage and innovation. The near tie between wood and charcoal to create that famous blue smoke honors time-tested smoking and grilling practices, while the rise of pellets in the Upstate and Midlands marks a growing embrace of technology-driven control.
Gas and electric fill the niche for fast, no-fuss cooks—particularly in coastal and urban-adjacent counties—without displacing core smokers. Even as modern fuels gain ground, traditional methods like concrete pits and ground fires persist in rural heartlands. Ultimately, these patterns reveal a backyard BBQ culture that values both its deep-seated past and its forward-looking spirit.
Cooking BBQ in SC: Conclusion
Cooking BBQ at home is a cornerstone of South Carolina’s barbecue culture. Nearly four in five residents fire up their own rigs—whether that’s a dedicated smoker, a pellet grill, or a classic charcoal kettle. Across every corner of the state, pork reigns supreme: well over 90 percent of DIY cooks turn to pork cuts (butts and shoulders), with pork ribs and chicken rounding out the core lineup.
When it comes to equipment, specialized smokers lead the way, followed by pellet grills, charcoal cookers, gas grills, and ever-popular egg-style units. Fuel choices mirror this hierarchy: wood and charcoal share the top spot, pellets hold strong in third place, and gas and electric fill in the rest.
Regionally, the Pee Dee and Lowcountry boast the highest rates of home cooking, while the Upstate shows a marked preference for pellet grills and brisket. County-level extremes—like Abbeville’s 100 percent pork-cut cooks, Laurens’s leadership in both pork and beef ribs, Edgefield’s chicken loyalty, Greenwood’s brisket and turkey success, Barnwell’s sausage focus, and Williamsburg’s whole-hog traditions—highlight how local tastes layer atop a solid statewide preference for pork.
Together, these findings paint a vivid portrait of South Carolina’s backyard BBQ scene: passionate, pork-driven, and powered by a blend of time-honored methods and modern conveniences. Whether you’re in the heart of the Midlands or down in the Lowcountry, the spirit of DIY barbecue remains a unifying thread across the Palmetto State.
SC BBQ in the Digital Age: Website Searches, Google Data, and Facebook Conversations
Destination BBQ’s Restaurant Map: Search Volume, Filter Trends, and Top Queries
Introduction
Between March 20, 2023 and April 24, 2025, the WP Store Locator plugin, which powers our interactive SC BBQ Trail Map on Destination-BBQ.com, recorded 24,468 map searches and filter interactions. This analysis examines three dimensions of those stats—daily search volume, category-filter usage, and most-searched locations—while acknowledging that my own routine lookups in ZIP code 29464 have skewed the location data for that area.
Analysis
Daily Search Volume
- Overall activity: A total of 24,468 searches over 767 days, averaging about 31.9 searches per day.
- Consistency & growth: The average daily searches rose modestly from 31.7 in the first year (Mar 20, 2023–Apr 24, 2024) to 32.1 in the second year (Apr 25, 2024–Apr 24, 2025), indicating steady engagement.
- Peaks & troughs: The highest single‑day volume was 275 searches on July 13, 2023—perhaps reflecting a promotional push—while the low point was zero searches on June 5, 2023.
Category‑Filter Usage
Visitors to the map filtered by the following category tags (total filter clicks = 5,630):
- Hash dominated with 3,700 clicks (65.7%)
- 100 Mile BBQ was second at 797 clicks (14.2%)
- Buffet attracted 371 clicks (6.6%)
- Whole Hog (4.1%)
- Mustard Sauce (3.1%)
- True ’Cue Certified (2.9%)
This suggests that “Hash” remains the most sought‑after feature in SC BBQ searches, with regional trail and buffet options also resonating.
Top Location Searches
The most‑queried locations (search events = 3,284 for top 10) were:
- ZIP 29464: 865 searches
(Note: this is inflated by the site owner’s own map tests and shouldn’t be taken as representative.) - Columbia, SC: 524
- Charleston, SC: 307
- Greenville, SC: 286
- ZIP 29150 (Sumter area): 281
- ZIP 29072 (Lexington area): 255
- Florence, SC: 233
- ZIP 29201 (downtown Columbia): 191
- Myrtle Beach, SC: 185
- ZIP 29607 (Greenville area): 157
Once 29464 is set aside, Columbia leads by a healthy margin, followed by Charleston and Greenville—underscoring those metros as key draw areas.
Key Takeaways
- Reliable interest: Across two years, South Carolinians and BBQ fans nationwide searched the SC BBQ map averaging about 32 lookups per day, showing steady demand for barbecue locations.
- Hash dominates: More than two-thirds of those filter selections focused on hash options—underscoring hash’s status as a signature element of South Carolina barbecue.
- Main hubs: Excluding the publisher’s own ZIP, the most-searched areas are Columbia, Charleston, and Greenville, reflecting where BBQ trails and dining scenes draw the most attention.
Map: Final Thoughts
Map-search activity paints a clear picture: readers consistently use our locator tool to find SC barbecue—especially hash offerings—concentrated in the state’s major metropolitan regions. Recognizing this steady baseline and the standout popularity of hash can guide future storytelling and outreach, ensuring we highlight the flavors and locales that matter most to our SC BBQ community.
Even beyond Columbia, Charleston and Greenville, the map data shows a broad “long tail” of smaller towns and rural communities—proof that SC BBQ passion isn’t confined to the big cities:
- Steady, low-volume searches in places like Beaufort, Aiken, Florence and Orangeburg (each logging roughly 1–3% of total lookups) indicate consistent interest in outlying areas.
- Coastal and Upstate reach: Zips around Hilton Head/Bluffton and Spartanburg each contributed dozens of searches—underscoring that both ends of the state turn to the locator tool.
- Collective impact: While no single small town rivals the metros, these outlying zips together account for about 15% of all map lookups.
Google Analytics Analysis
Digital Footprint of South Carolina Barbecue: Website Traffic Insights
Introduction
As part of our SC BBQ Survey Report, we analyzed organic‐search traffic on Destination-BBQ.com (Jan 1, 2024–Apr 24, 2025) to see how digital behavior parallels in-person preferences. By examining where visitors come from and which restaurant and recipe pages they click, we gain a real-time snapshot of South Carolina barbecue’s broader appeal.
1. Regional & Device Trends
Local loyalty, with regional reach:
- Folks in South Carolina accounted for 17,793 organic‐search visits (≈ 41% of the total),
- North Carolina followed with 8,890 (20%),
- Georgia with 7,337 (17%).
This pattern underscores that while SC BBQ’s core audience is in‐state, significant interest also spills over into neighboring markets.
Mobile‐first behavior:
- 78% of those visits came from smartphones,
- 21% from desktop computers,
- and just 1% from tablets or other devices.
Nearly 80% of visits come from smartphones, showing that barbecue fans are looking up restaurant spots and recipes on the go—whether planning a drive‑through lunch or cooking at home.
2. Top Organic Landing Pages
Among the trackable pages, visitors to Destination BBQ first land primarily on restaurant pages (beginning with /stores/), the home page, and recipe content:
| Table 15 | ||
| Page | Total users | New users |
| /stores/scotts-bar-b-que/ | 24,209 | 23,296 |
| (not set) – untracked | 15,237 | 2 |
| / (home page) | 14,363 | 10,775 |
| /dukes-bbq-style-hash/ | 11,499 | 10,547 |
| /dads-mop-sauce/ | 10,771 | 10,456 |
| /stores/the-spotted-pig/ | 9,541 | 9,271 |
| /stores/the-little-pigs-of-anderson/ | 7,079 | 6,889 |
| /stores/antleys/ | 6,170 | 5,896 |
| /stores/carolina-bar-b-que/ | 6,050 | 5,865 |
| /rodney-scotts-bbq-sauce-recipe/ | 5,853 | 5,396 |
- Scotts Bar-B-Que draws nearly one-quarter of all organic users.
- Recipe and sauce pages (Dukes hash, Dad’s Mop Sauce, Rodney Scott’s sauce) firmly hold the next tier.
- A sizable “(not set)” segment indicates some users bypassed tracking parameters—common when landing via aggregated or app-based referrals.
Key Takeaways
- Scotts Bar-B-Que’s iconic status: As the top landing page, Scotts Bar-B-Que clearly resonates—readers seek out this legendary pit more than any other single location.
- Sauces & hash as cultural anchors: Dukes-style hash and Dad’s Mop Sauce pages draw nearly as much interest as restaurant profiles, underscoring that South Carolina’s signature flavors are as central to the SC BBQ story as the meat itself.
- Beyond the marquee names: After the top three, well-known spots like The Spotted Pig and Little Pigs of Anderson each attract thousands of visitors, reflecting a rich tapestry of regional favorites across the state.
- Newcomer curiosity: The homepage ranks third in organic entries, indicating many first-time visitors begin with a general overview—proof that SC BBQ’s history and context are compelling hooks for newcomers.
GA4: Final Thoughts
The website analytics dovetail with our statewide survey, highlighting SC BBQ’s strong local roots and growing regional footprint. For journalists and industry stakeholders, these digital insights point to the key stories—hero pitmasters, iconic side dishes, and mobile-driven discovery—that continue to shape South Carolina’s barbecue narrative.
Facebook Group Activity Mirrors South Carolina Barbecue Passion
Introduction
Alongside our statewide survey of barbecue tastes, we examined the I Love SC BBQ Facebook group’s year-long engagement (Apr 25, 2024–Apr 24, 2025). This community of enthusiasts offers a real-time lens on which topics spark conversation, how widely content circulates, and where the barbecue faithful gather online.
Analysis
- Steady Membership Growth
- 1,535 new members joined over 12 months—an average of 4 new members per day—demonstrating continued interest in South Carolina barbecue discussion.
- 29,463 total members comprised the group as of April 30, 2025.
- Daily Content Consumption
- Group members collectively viewed about 11,800 posts each day, underscoring strong demand for barbecue news, recipes, and restaurant recommendations.
- On average, members created 10.4 posts, left 142 comments, and gave 493 reactions per day.
- Core Contributors vs. Casual Observers
- Roughly 22 members post or comment on any given day, while thousands read quietly—reflecting a typical “1% rule” where a small core drives the conversation for a much larger audience.
- Engagement Spikes
- Peak posts: 26 posts on Nov 29, 2024
- Peak comments and reactions: 833 comments and 2,932 reactions (with 86,271 views) on Jan 5, 2025
- Peak views: 138,855 post views on Apr 23, 2025
Key Takeaways
- Community Vitality: Adding over 1,500 members in a year and almost 30,000 overall shows that South Carolina barbecue remains a vibrant topic well beyond the smokehouse.
- Enduring Interest: Daily viewership in the tens of thousands highlights the group’s role as a go-to hub for conversation on all things SC BBQ.
- A handful of voices, wide reach: Each day, just ~20 members spark the conversation, yet their posts attract thousands of views—showing how a small core of enthusiasts fuels a much larger community dialogue
- When BBQ breaks news: On days featuring hot topics, engagement can skyrocket—comments and reactions spike alongside view counts exceeding 80,000—underscoring the group’s power to rally around standout moments in the SC BBQ world.
Facebook: Final Thoughts
The Facebook Group Insights complement our survey findings by revealing how South Carolina barbecue fans connect and converse online. From steady member growth to occasional viral spurts, the group’s activity underlines the communal spirit that fuels both digital engagement and real-world barbecue traditions across the Palmetto State.
Digital Data: Conclusion
From 24,468 map searches on Destination BBQ to 80,000+ organic‑search visits and nearly 30,000 Facebook members, South Carolina barbecue shines online as brightly as it does at the pit. Iconic flavors—hash and classic sauces—consistently top the lists, while smaller towns together generate 15% of searches and thousands of daily page views. A core group of roughly 20 contributors sparks conversations that ripple out to thousands of readers, and engagement spikes on big news days underscore the community’s enthusiasm.
Taken together, these findings echo our survey results: SC BBQ is more than a local meal—it’s a statewide (and regional) cultural phenomenon with deep roots and a broad, passionate following.
Report Conclusion: What the 2025 Survey Reveals About the BBQ Identity of South Carolina
As our survey shows, South Carolina’s barbecue scene is as rich and varied as the landscapes that stretch from the Upstate mountains to the Lowcountry coast. Across more than 1,300 respondents, we captured a detailed portrait of what makes SC BBQ tick—from the cuts of meat that land on your plate to the sauces that finish the dish, the sides that round out the meal, and the cooking methods that bring those flavors to life.
Pork remains the undisputed centerpiece: whole hog and pork cuts drew the strongest support, with spareribs and brisket also holding steady among regional favorites. Yet it’s clear that no single approach dominates—respondents across different corners of the state showed unique preferences, reminding us that “classic” BBQ in South Carolina is less a single style and more a spirited conversation.
When it comes to sauce, the mustard- and vinegar-based blends that define the Midlands and Pee Dee more than held their own against the influx of national brands. Homemade recipes still play an important role, but store-bought and restaurant-sourced sauces both earned significant followings, underscoring the balance between DIY tradition and commercial convenience.
Charcoal grilling and wood smoking continue to anchor South Carolina’s cooking techniques, although gas and pellet grills have made notable inroads—particularly in suburban and urban areas where ease of use matters. This blend of time-honored practice and modern adaptation reflects a community that honors its roots while embracing innovation.
Hash—served most often over rice—and sides like baked beans, coleslaw, and mac and cheese proved nearly universal crowd-pleasers, yet the strength of those preferences varied by county, highlighting pockets of distinct local identity. And while the Dukes name topped our restaurant votes, digging deeper reveals a constellation of independent joints—each beloved for its own take on smoke, sauce, and service.
Taken together, these findings paint a picture of South Carolina BBQ as a living tradition: fiercely local yet broadly shared, steeped in history but always evolving. For pitmasters, restaurateurs, and enthusiasts alike, this report offers both affirmation of what’s working and clues to where new opportunities lie—whether that’s experimenting with hybrid cooking methods, refining a signature sauce, or spotlighting under-the-radar sides that surprise and delight. In South Carolina, barbecue isn’t just a meal; it’s a way of celebrating community, creativity, and the simple joy of gathering around the fire.
Want to shape next year’s findings? Be the first to know when our 2026 SC BBQ Survey goes live—sign up here and make your voice heard:
Get Notified
South Carolina BBQ Survey FAQ: Key Questions and Answers
Over 1,350 people took part, with respondents representing all four regions—34% Midlands, 28% Upstate, 23% Lowcountry, and 16% Pee Dee—and skewing older (73% aged 45+) and male (87%).
Barbecue is a regular ritual: roughly 53% enjoy it a couple times per month, 20% once a week, another 20% once a month, with only 7% rarely and fewer than 1% never.
Pork reigns supreme—55% chose pork cuts (butts/shoulders) and 49% whole hog—followed by pork ribs (29%) and brisket (27%), with chicken, sausage, and beef ribs trailing.
Mustard‑based sauce is the statewide favorite (43% #1 pick), vinegar‑based comes second (33%), and light tomato third. Regionally, the Midlands (83%) and Lowcountry (65%) back mustard, the Pee Dee backs vinegar (70%), while the Upstate shows a more even split among light tomato, mustard, and heavy tomato.
The state is nearly split—34.4% buy it at a store, 33.7% make it at home, and 25.2% purchase from an SC BBQ restaurant or vendor, with the Pee Dee most likely to DIY (48%) and the Upstate/Lowcountry leaning toward store brands (39%).
Only coleslaw tops 50% (54%); mac & cheese is 47% and baked beans 43%, both under half. Hash appears on 40% of plates. And for hash styles, pork hash is 62.4% is tops and served over rice 75% is the preference .
36% dine out a couple times per month and only 9% weekly; per‑person spending centers at $16–20 (48%). Top priorities are meat options (61%), wood‑cooked flavor (49%), and side dishes (41%), with sauces (37%) and hash (33%) also in diners’ top three.
Most keep indulging—79% say diet doesn’t affect how often they eat BBQ, and 91% say it doesn’t dictate which restaurant they visit—but a noteworthy minority (21% frequency; 9% choice) do adjust based on health.
Nearly 80% of respondents sometimes cook their own BBQ at home. Smokers lead the pack (50.6%), followed by pellet grills (29.9%) and charcoal grills (23.2%), with regional pockets still using concrete pits and even hole‑in‑the‑ground methods.
In a reputation‑based question (n = 1,086), respondents most frequently named Scott’s Bar‑B‑Que (26.8%), followed by Rodney Scott’s BBQ (13.7%), Lewis Barbecue (11.6%), Dukes BBQ* (9.3%), and Shealy’s (7.7%).
*"Dukes BBQ" comprises a family‑founded brand of multiple, legally independent restaurants that share the same name, not a specific Dukes BBQ location.
Share the flavor. If you found these insights useful, click share and pass this report on to your BBQ crew and help grow our SC BBQ community.
Methodology & Tools
Survey Collection
- Platform & Period: Responses gathered via Fillout.com from May 2, 2024 to April 30, 2025
- Total Responses: 1,350 + valid entries across all four SC regions
Data Cleaning & Processing
- Python & Key Libraries (via ChatGPT)
- pandas: CSV import, merging, reshaping, pivoting multi‐select fields
- numpy: missing‐value handling and numeric operations
- re: standardizing text fields (county names, answer labels)
- openpyxl: Excel exports and spot checks
- Notable Steps
- Deduplication: dropped exact‐duplicate rows by respondent ID and timestamp
- County Normalization: trimmed whitespace, enforced title case, applied lookup map for misspellings
- Placeholder Handling: removed “Grand Total” columns; recoded stray “Option 1”/blank entries as “Other”
- Low‐Volume Aggregation: flagged counties with
- Multi‐Response Consolidation: exploded comma‐separated answers into individual rows, then re‐pivoted for counts
- Dataset Merge: left‐joined supplemental county/region CSVs on normalized county field
- Manual Validation (Excel & Apple Numbers)
- spot‐checked totals, pivot tables, and outliers against Python outputs
Statistical Analysis
- Conducted in Python (pandas) via ChatGPT and Excel and Apple Numbers pivot tables
- Summary scripts compared raw vs. cleaned counts at each stage to ensure integrity
Digital Data Sources
- WP Store Locator (Mar 20, 2023–Apr 24, 2025)
- Map Searches & Filters: 24,468 total searches (avg 31.9/day); 5,630 total filter clicks (Hash 65.7%, 100 Mile BBQ 14.2%, Buffet 6.6%, etc.)
- Top Query Locations: ZIP 29464 (865), Columbia (524), Charleston (307), Greenville (286), Irmo (281), Lexington (255), Florence (233), downtown Columbia (191), Myrtle Beach (185), Greenville area ZIP 29607 (157)
- Google Analytics 4 (Jan 1, 2024–Apr 24, 2025)
- Organic‑Search Visits: 43,277 total, with 17,793 (41%) from SC, 8,890 (20%) NC, 7,337 (17%) GA
- Device Breakdown: 78% mobile, 21% desktop, 1% tablet/other
- Top Landing Pages: /stores/scotts-bar-b-que (≈ 25% of organic entries), followed by recipe/sauce pages (Dukes hash, Dad’s Mop Sauce, Rodney Scott’s sauce), then homepage
- Facebook Group Insights (Apr 25, 2024–Apr 24, 2025)
- Membership Growth: +1,535 members (avg 4/day), total 29,463
- Daily Engagement: ~11,800 post views, 10.4 posts, 142 comments, 493 reactions per day
- Peak Activity: 26 posts on Nov 29 2024; 833 comments & 2,932 reactions (86,271 views) on Jan 5 2025; 138,855 views on Apr 23 2025
Visualizations & Mapping
- Charts & Tables: Designed in Apple Numbers and Python (matplotlib)
- Final Polishing: Exported and formatted in Excel for consistency with site styles
SEO & Publishing
- On‑Page Optimization: Managed via Yoast SEO on WordPress for title, meta, and schema
- Structured Data: Article and FAQPage schema implemented through Yoast blocks
AI‑Assisted Drafting
- Supported by OpenAI’s ChatGPT (model o4‑mini) for narrative flow and readability
- All AI‐generated text underwent author review and manual editing
Data Availability
- A master CSV of the cleaned and merged dataset will be provided via a downloadable link on this page
Quality Control
- Entire analysis, visuals, and copy were reviewed and proofread solely by the author prior to publication
Tommy Connolly
Friday 16th of May 2025
James, What great work with the survey. I grant you an honorary Doctorate ! Not surprised by most of the results, but mostly the age demographic. Some of these youngsters are missing out !! Tommy
James Roller
Friday 16th of May 2025
@Tommy Connolly, Haha....thanks! I'll take it. Probably has to do with the nature of things. I'm guessing the demographics probably mirror those of my audience which would make sense.
David Mobley
Thursday 15th of May 2025
Great article. Thanks for compiling all of this information. Who else would do this but our local barbeque expert. Thanks again, we enjoy all your articles in Dillon County. See ya at Shuler's soon. David Mobley
James Roller
Thursday 15th of May 2025
Thank you, David. I appreciate the kind words.
Kris
Thursday 8th of May 2025
Awesome read. Makes me want to put a butt on the smoker this weekend. I can guarantee it will be mopped with Rodney Scott's. I could put that stuff on my pancakes. That's how good it is.
James Roller
Thursday 8th of May 2025
@Kris, haha....glad you enjoyed. What time is dinner? 😉
Russ
Sunday 4th of May 2025
Very interesting. I found it a bit surprising that Myrtle Beach and Horry County in general weren't listed (although I may have missed a couple if they are there.)
James Roller
Monday 5th of May 2025
@Russ, the counties are problematic to include given that there are 46 of them, so the analysis typically reported on trends or outliers. You’re right, it seems like an oversight not to have much reporting on such an important area of the state, but it certainly wasn’t intentional.